Economic Anomalies
Why the Rules Don’t Apply Anymore
MICHAEL FOGARTY, CFA
Vice President

Economic, fiscal, monetary, and market conditions never align completely with history, making comparisons with the past imperfect. There was never a “last time” in which:
- The global economy was effectively shut down due to fears of a pandemic,
- Supply chains were stressed to the breaking point,
- Massive stimulus payments were made to reduce the impact of these shutdowns,
- Government debt ballooned by trillions of dollars, and
- Inflation spiked dramatically.
Some historically reliable economic indicators broke down in the face of this assortment of highly unusual circumstances.
A Recap of Actions
Massive stimulus and supply chain disruption unleashed inflation to levels the U.S. economy had not seen since the early 1980s. The Federal Reserve’s aggressive response to that inflation began in earnest in March 2022 when the Fed boosted its Fed Funds Rate (FFR) from its highly stimulative Covid-era 0% lower bound. Over the ensuing 16 months, the Fed ratcheted up the FFR to 5.50% by July 2023. After holding steady for 14 months at that very restrictive level, the Fed eased rates by 0.50% in mid-September 2024.
Restrictive monetary conditions were accompanied by an ongoing refrain of recession predictions. In the past, high inflation and the Fed raising interest rates in response, more often than not, led to recession. Tightening was usually followed by overshooting, leading to widespread labor market turmoil.
Fast forward to now, when the U.S. economy has avoided a broad-based decline in economic activity. Consumers who were flush with savings from pandemic-deferred spending and better-than-usual personal balance sheets were not affected as much as expected by higher borrowing costs. Supply chain normalization also helped to ease inflationary pressures. Several indicators softened, but none to a worrying degree, concurrent with continued GDP growth.
Failed or Untimely Indicators?
Inversion of the yield curve has been a relatively reliable and often-cited indicator of imminent recession. The yield curve is the difference in yields between two maturities of U.S. Treasury securities, typically the 10-year minus the two-year (or the 10-year minus the one-year). When that difference is negative, the yield curve is said to be inverted.
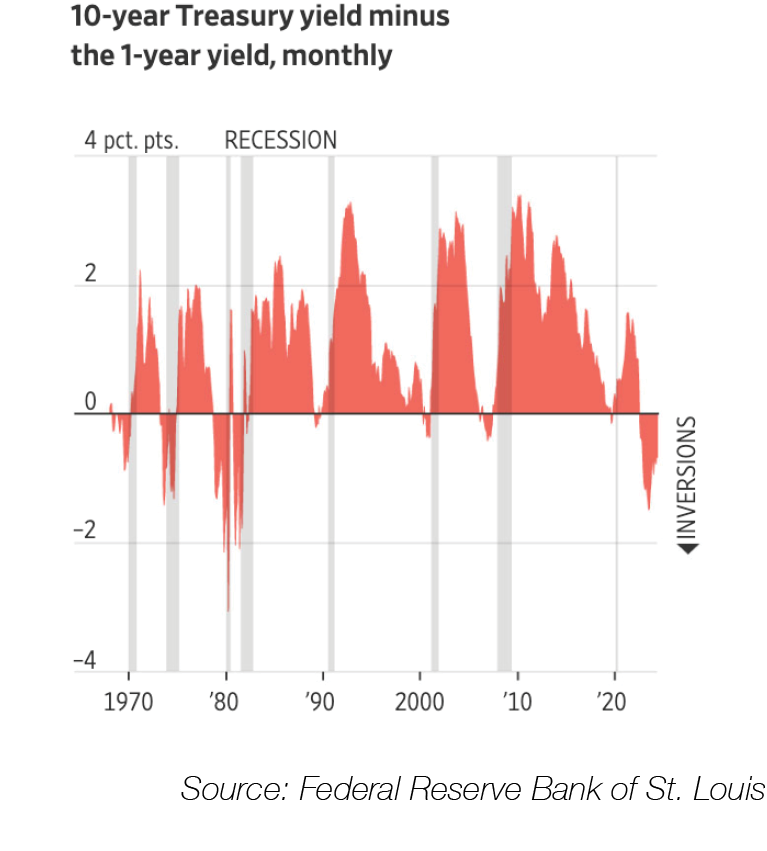
Investors expect the Fed to cut interest rates when longer-term yields are below short-term yields – often the Fed’s response to a weakening economy. Historically, an inverted yield curve was followed by a recession within 12 to 24 months. However, the yield curve was inverted between July 2022 and September 2024, but a recession has not occurred.
Several unique Covid-era factors have caused the yield curve signal to fall short in the recent past:
- Massive monetary policy intervention distorting bond market pricing;
- “Fed-subsidized” labor market skewing consumer spending behavior;
- Global push toward U.S. Treasuries driven by low (or negative) rates in Japan and Europe; and
- A massive support of businesses and consumers in response to global supply and demand disruptions.
The recent inflation spike was partly self-correcting as businesses recovered from supply chain disruptions and dramatic changes in customer behavior. The businesses were able to boost output to meet burgeoning, pent-up customer demand.
Whatever the cause, the sharp decline in inflation with only a small uptick in the unemployment rate has encouraged investors toward a soft-landing thesis.
In addition, the U.S. economy has added far more jobs than any comparable period that followed an inversion. Perhaps the underlying strength of the U.S. economy has stalled any recession that the yield curve may have predicted.
Additionally, as banks’ plentiful deposits have made them less reliant on borrowing Fed funds, inverted yield curves are less relevant/effective in transmitting financial conditions to the real economy.
Bottom line: The inverted yield curve has not been reliable as a recession indicator in this instance.
Additional Indicators
The “Sahm Rule” recession indicator was triggered in mid-2024. It signals a recession when the three-month moving average of unemployment rates rises by 0.50 percentage points or more from its low in the previous 12 months.
The rule has been reliable in the U.S. since the end of World War II. However, many economists (including its namesake, Claudia Sahm) have questioned its reliability in today’s economy due to several distortions, including growing household income and consumer spending and business investment remaining resilient even with restrictive monetary policy.
Add those to swings from labor shortages, with people dropping out of the labor force, to large immigrant inflows, to a spike in new job seekers, all causing material disruption to labor market statistics and perhaps a false signal from a historically reliable labor market recession indicator.
Gold prices, a traditional safe-haven asset, provide valuable insights. A gold rally typically reflects growing global economic uncertainty, concerns about inflation, or low real interest rates. It can signal that investors are seeking a haven because of a loss of confidence in more traditional investments like stocks or bonds or in the value of the U.S. dollar itself. A number of central banks have boosted their gold buying in a meaningful way, pushing up prices.
Conclusion
We are aligned with the “soft landing” consensus, which expects the U.S. GDP to soften later this year and in early 2025 before rising in the second half of 2025. Softening is driven primarily by the delayed effect of monetary tightening and the depletion of household excess savings.
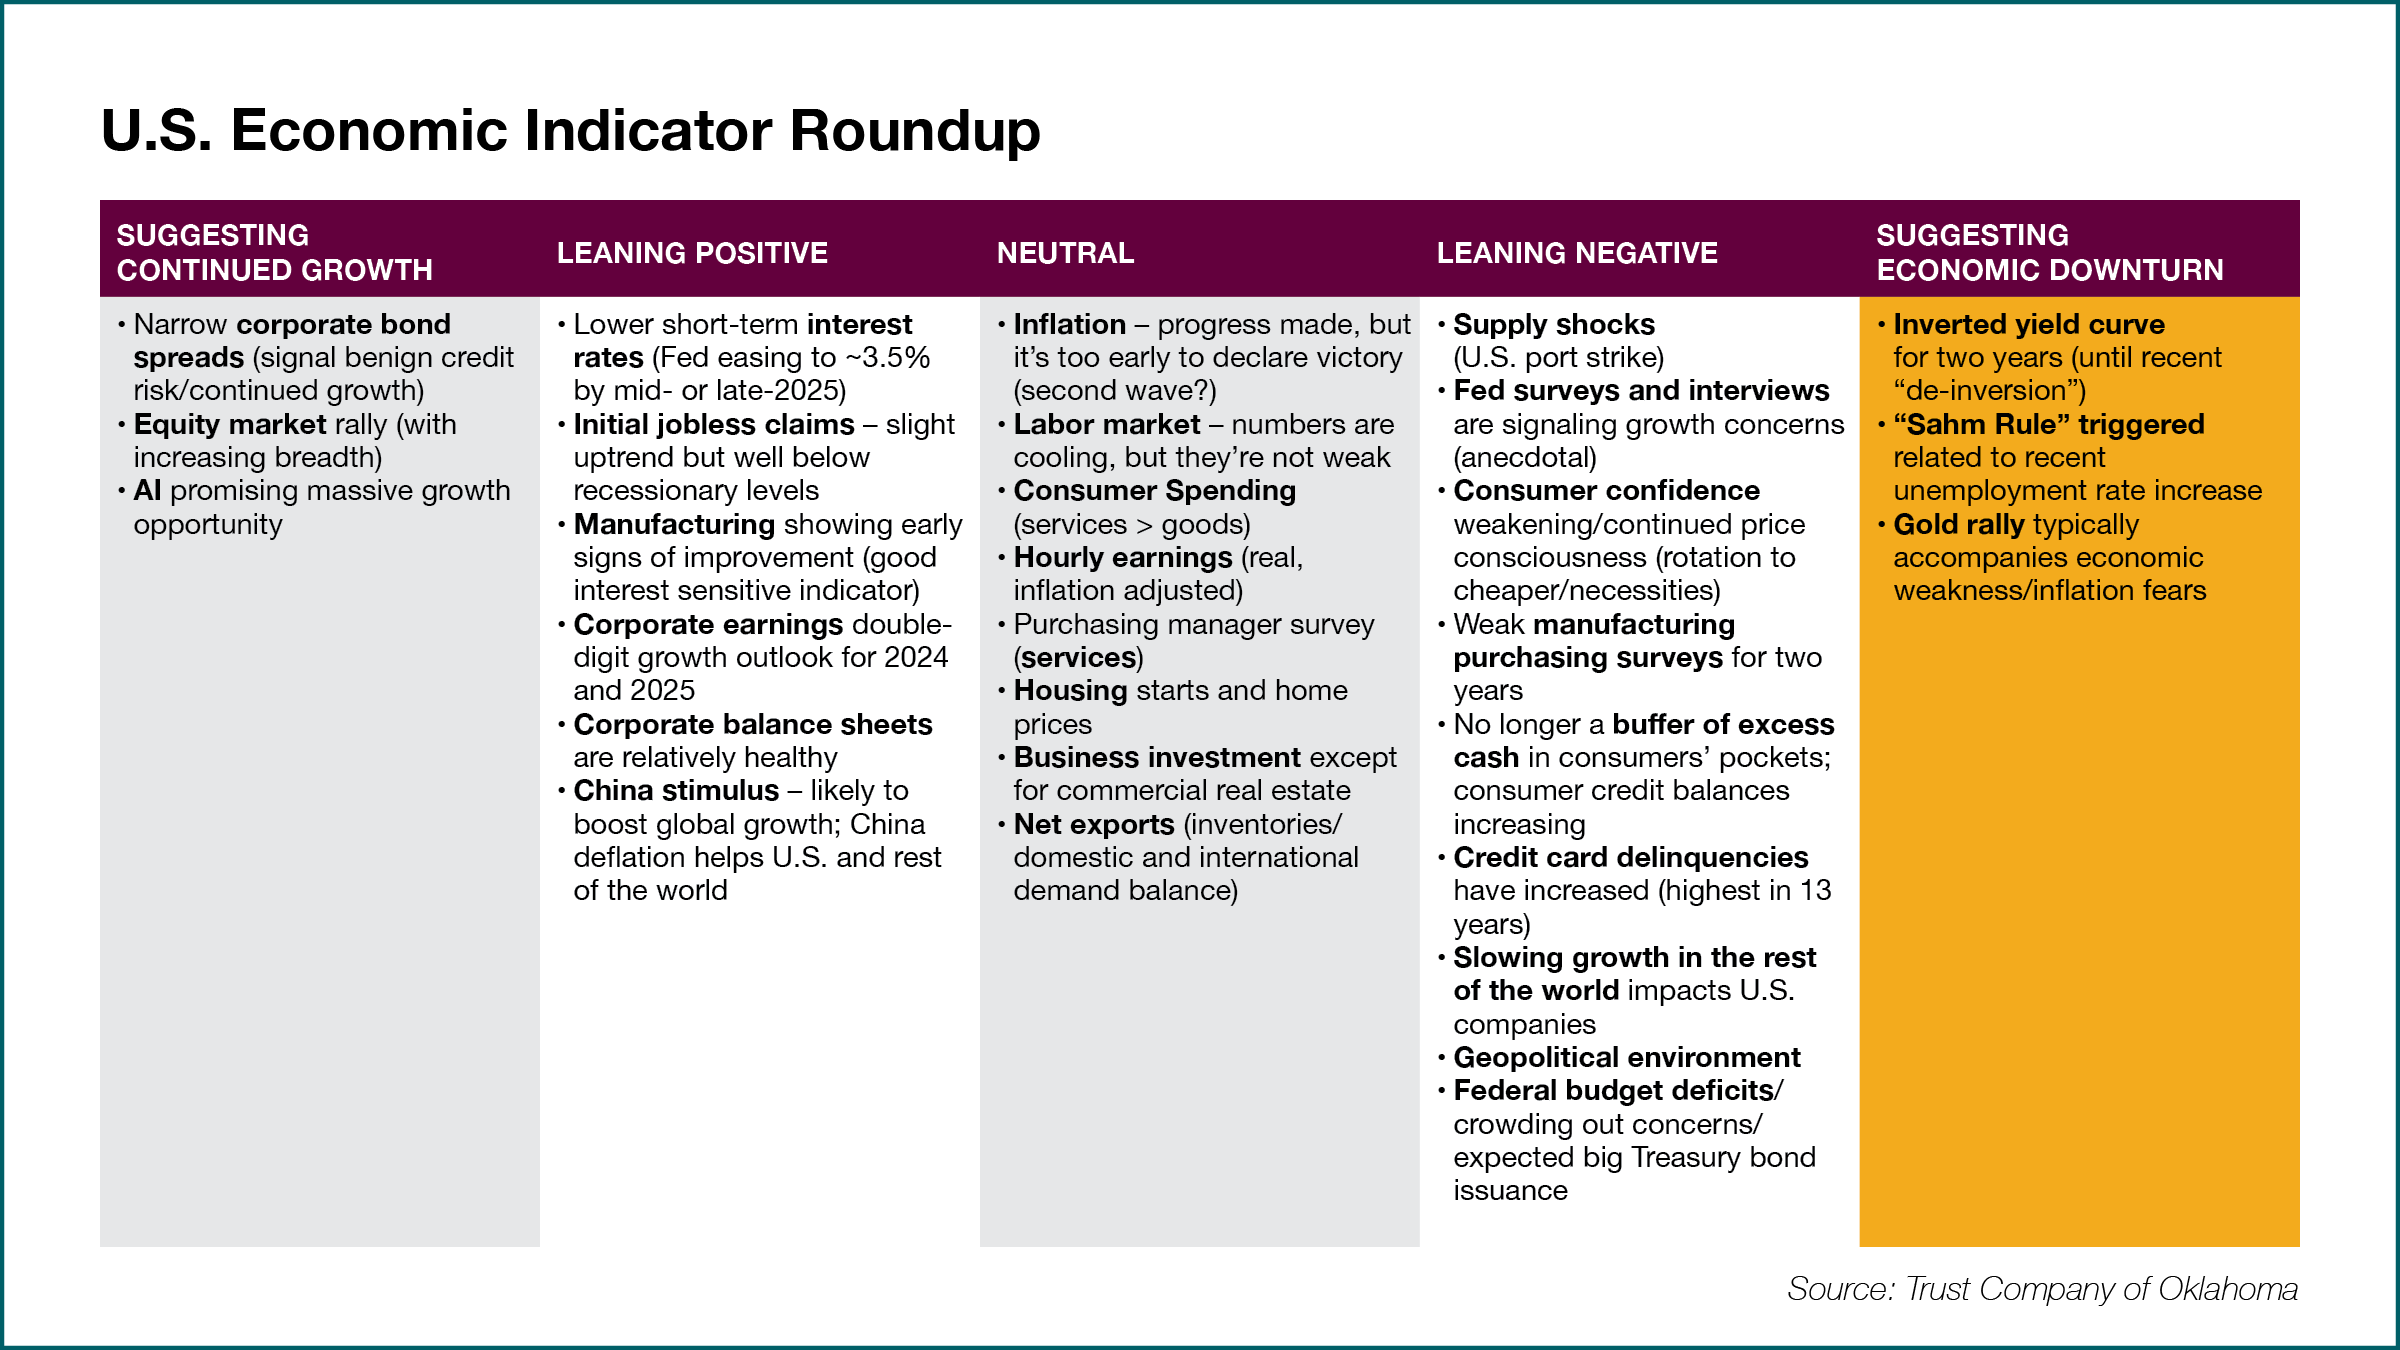
The accompanying table (above) shows our view of economic indicators and the signals they are currently exhibiting. Readers are encouraged to contact their TCO representatives to discuss our constantly evolving views on these indicators and how those views inform our approach to investment management.

MICHAEL FOGARTY, CFA
Vice President
(918) 744-0553